
Hyperlocal Air Quality Monitoring in The Weather Channel Update
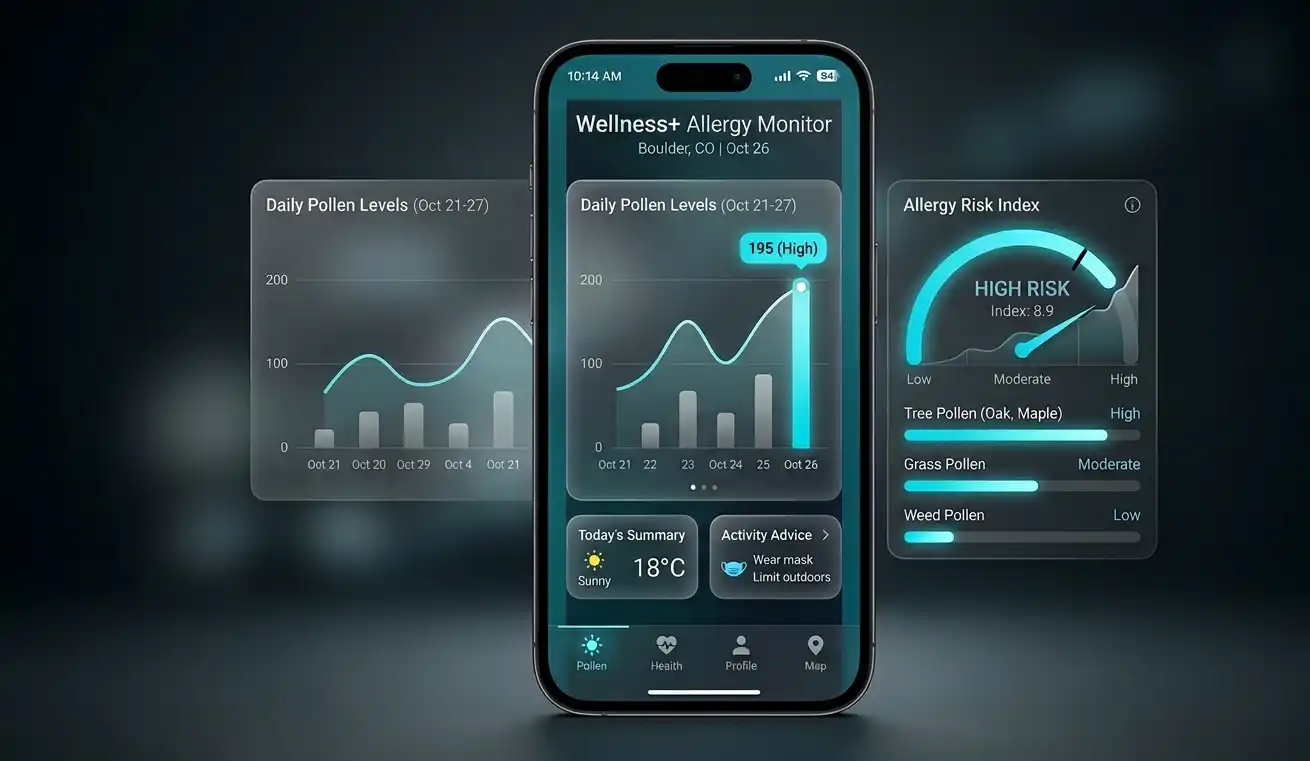
The Weather Channel mobile application has received a major update to its interface and analytical algorithms, aimed at helping people with seasonal allergies. The new feature integrates detailed pollen concentration reports directly into the standard five-day weather forecast. This allows users to more accurately assess health risks when planning outdoor activities.
Instead of generalized air quality indices, the updated platform analyzes a complex set of meteorological factors. Forecasting is based not only on the current number of pollen grains per cubic meter, but also on humidity, wind speed, temperature, and historical data for a specific region. This approach helps minimize the uncertainty factor for sensitive individuals.
How the Meteorological Trigger Analysis Algorithm Works
The new tool is called Weather Aggravator Insights. The main difference from previous versions is that the system does not just state the fact of high allergen concentration, but predicts changes in the atmospheric condition. For example, strong wind at low humidity promotes rapid dispersal of tree and grass pollen over long distances, while prolonged rain clears the air but can stimulate further active blooming.
The app interface has been adapted for quick information consumption. Users see personalized tips recommending they close windows, turn on an air purifier, or limit long walks during peak hazard hours. All data is displayed using graphical widgets with soft backlighting.
Impact of Climate Change on Blooming Season Duration
The developers note that the need for such a tool is driven by global climate change. Observations show that due to rising average annual temperatures and shifting precipitation patterns, the blooming periods of many plants start earlier and last longer. This increases the burden on the immune system of people suffering from pollinosis.
The integration of real-time medical and meteorological data is becoming a standard for modern weather services. Thanks to automated information collection from thousands of local observation stations, the app can warn of a sharp increase in danger hours before a person feels the first symptoms.
Technical Features of the Interface Implementation
The update is already available for users of mobile devices running iOS and Android operating systems. The developers optimized home screen widgets so that key pollen metrics are available without having to fully open the app. The visual style is based on the principles of clarity, where hazard levels are separated by an easy-to-understand color scale from low to extreme.
To ensure high accuracy, the company uses a combination of satellite imagery, ground sensors, and mathematical models of aerosol dispersion. This allows for the generation of individual reports down to a specific neighborhood, which is especially important in dense urban areas that trap pollen and smog.



0 Comments